
Impact of Technical Changes in AI Based Detection of HFpEF and Model Performance and Prognostication
Christy Zheng, MS1, Ashley P. Akerman, PhD2, Katharine Rainer, MD1, Nora Al-Roub, MBBS1, Constance Angell-James, MPH1, Rasheed Thompson, BS1, Lorenzo Bosque, MSc, MPH1, William Hawkes, PhD2, Hania Piotrowska, BA1, Paul Leeson, BM2, Gary Woodward, PhD2, Patricia A. Pellikka, MD3, Ross Upton, PhD2, Jordan B. Strom, MD, MSc1
1 Smith Center, BIDMC, Boston, MA; 2 Ultromics Ltd., Oxford, UK; 3 Mayo Clinic, Rocester, MN
Background
Deep learning (DL) using echocardiographic (TTE) images to detect HFpEF has shown promise,1 but the influence of technical factors and improvements on model classification and prognostic performance remains uncertain.
Objectives
To determine how technical improvements in an AI HFpEF-recognition software trained on TTE images impacts the diagnostic and prognostic performance.
Methods
- Study population: Patients receiving clinically indicated TTEs at BIDMC, 2018-2022
- Study design: Case control study comparing cases with HFpEF (recent HF hospitalization, LVEF ≥ 50%, and grade II/III diastolic dysfunction) and 1:1 age-, sex-, and year-of TTE matched controls.
- Exposure: Three iteratively improved DL algorithms predicting HFpEF presence (V1, V1.1, V2, Ultromics Ltd., Oxford, UK)
- Outcomes: AUC for HFpEF presence, time to mortality
- Analysis: AUCs compared across software versions. Survival techniques used to estimate time to mortality by predicted risk quartile. Random forest model used to identify technical variables related to model prediction.
Results
- 584 patients included (74.7 ± 12.8 years, 55.7% female, biplane LVEF 63.2 ± 7.4%) (Cases = 283, Controls = 293)
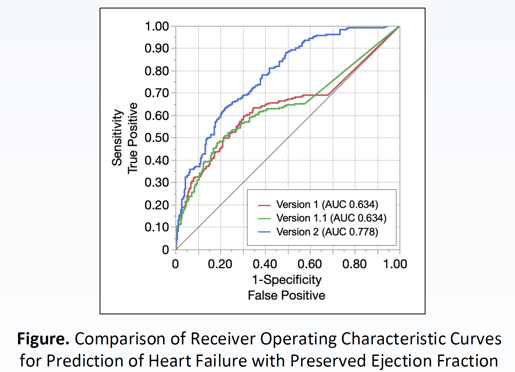
- V1 and V1.1 had similar discrimination (AUC 0.634, 95% CI 0.582-0.683 vs. AUC 0.634, 95% CI 0.584-0.682, p = 0.99)
- V2 improved upon prior performance (V2 vs. V1.1, AUC 0.778, 95% CI 0.735-0.816 vs. AUC 0.634, 95% CI 0.584-0.682, p < 0.001) (Figure).
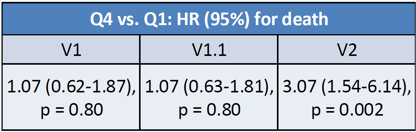
- Median (IQR) follow-up of 101 (27-382) days
- 112 (19.2%) deaths
- Of 22 technical parameters, top contributors to prediction included model uncertainty score, instability score, sequence of ultrasound regions, heart rate, and image compression ratio.
Conclusion
Enhanced pre-processing and image augmentation techniques in the V2 software resulted in improvements in model discrimination and death prognostication.
These results overall indicate the important role of non-clinical variables in ensuring robust and reliable DL model performance.